Applied project / Simulation modeling
Marine Door Manufacturing Simulation
A production process translated into connected stations, queues, transport resources, and routing logic. The documented T5 configuration explores process variability and resource constraints, with a companion flowchart that makes its assumptions inspectable.
Model overview
Modeling approach
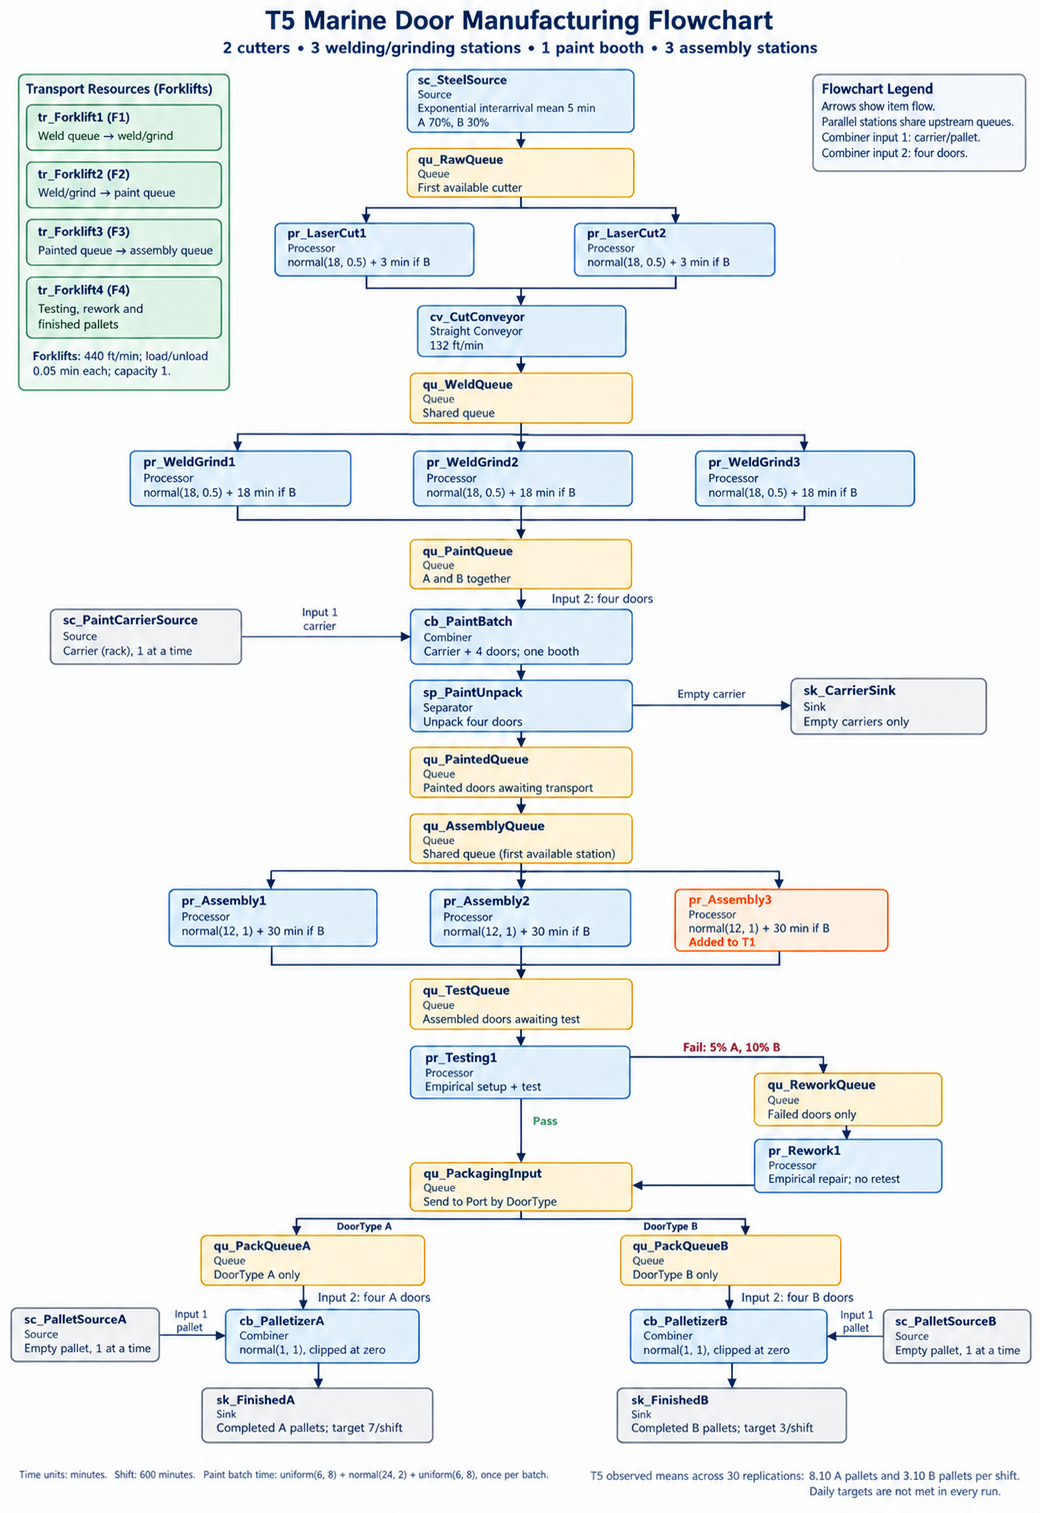
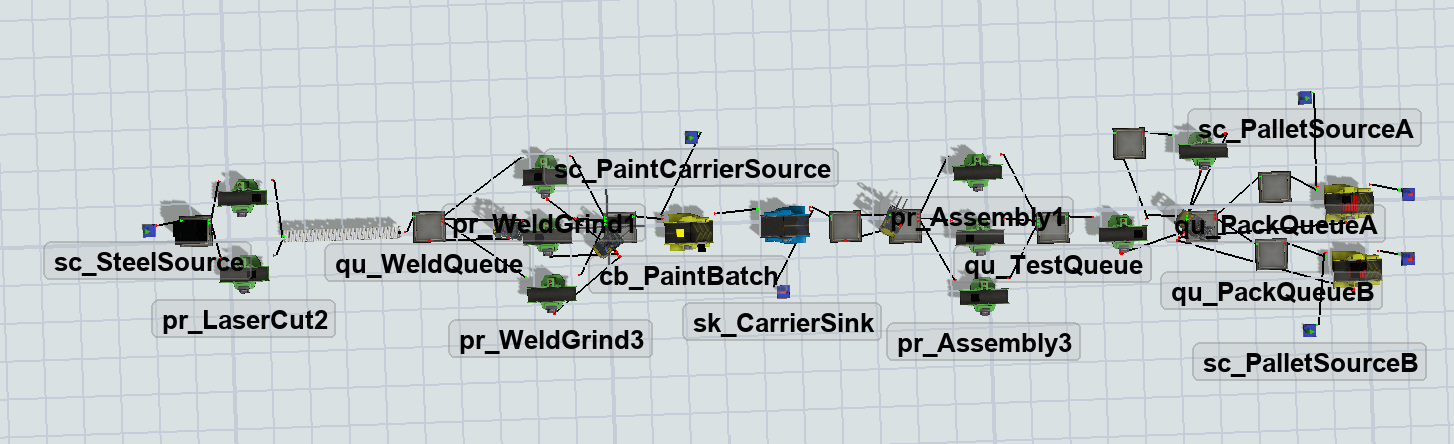
The documented T5 configuration uses two cutters, three welding/grinding stations, one paint booth, and three assembly stations. Variable arrivals and processing times, two door types, queues, carrier and pallet batching, and shared transport resources connect the process. The flowchart records its timing, routing, and resource assumptions.
Testing, rework, and packaging
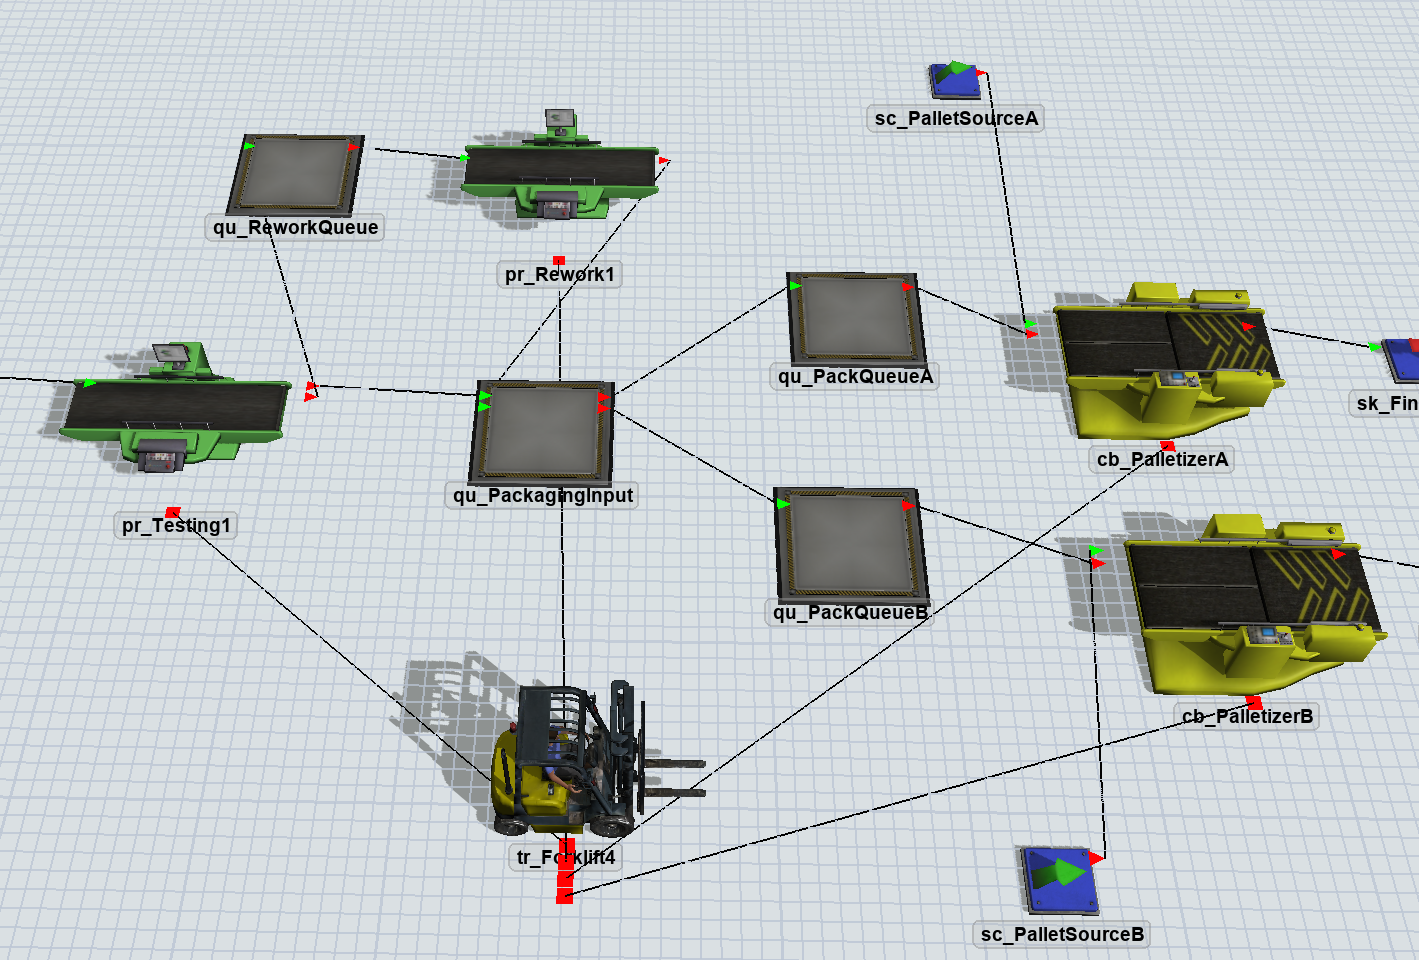
Testing routes failures into a rework queue and station before packaging. Separate Type A and Type B palletizers and a shared forklift make downstream resource dependencies visible.
Reported results—not guaranteed daily output
Across 30 replications, the reported averages were 8.10 Type A pallets and 3.10 Type B pallets per shift, against targets of 7 and 3. Those averages do not mean both daily targets were met in every run: they were not. These are figure-reported simulation results, not independently reproduced results or measured production performance.
Human factors relevance
The model provides a foundation for questions about queues, task allocation, transport, bottlenecks, and work demands. It demonstrates systems modeling; it does not measure human workload or physical ergonomics. Those questions would require additional performance measures.
Process flowchart